An Automated Method for Quantification of Two Dimensional Videokymography and Its Usefulness


Copyright 2020 ⓒ Korean Speech-Language & Hearing Association.
This is an Open-Access article distributed under the terms of the Creative Commons Attribution Non-Commercial License (http://creativecommons.org/licenses/by-nc/4.0) which permits unrestricted non-commercial use, distribution, and reproduction in any medium, provided the original work is properly cited.
Abstract
Vibration of the vocal cords is an essential part of voice production. A method for quantifying vibration is essential for the detection, diagnosis, and treatment of various voice disorders. The present study offers an automatic quantitative method to describe vibration properties and analyzes its clinical usefulness in evaluating pathological vocal cords via two-dimensional videokymography (2D VKG).
The proposed method is based on image processing, which combines an active contour model with a genetic algorithm to improve the accuracy of detection and processing speed. It can accurately extract the vibration wave in two-dimensional videokymograms. The extracted 2D VKG information can be automatically converted into objective values in terms of five parameters (fundamental frequency [F0], open quotient [OQ], closed quotient [CQ], phase symmetry index [PSI], and amplitude symmetry index [ASI]). We compared the recovery of the vocal cords in a 52-year-old male with acute laryngitis by performing 2D VKG at 1, 3, and 4 weeks.
F0 was not measurable at 1 week. After 4 weeks, it could be measured (117.24 Hz) after vocal cord vibration was observed. CQ, which reflects the degree of vocal cord contact, increased from 38% to 44%, while OQ decreased from 62% to 56%. PSI, which shows the regularity of the vocal cords, decreased from 0.148 to 0.72, while ASI decreased from 0.175 to 0.081.
The method used in this study allows easy analysis of vibratory parameters and quantifies mucosal wave parameters of vocal cord vibrations. Presenting the state of vocal cord vibration as a numerical value may increase clinical utility, as it is possible to compare the recovery of the vocal cords objectively.
초록
성대의 진동은 음성 산출의 필수적인 부분이며, 성대진동을 정량화하는 방법은 다양한 후두 질환의 감지, 진단 및 치료에 필수적이다. 본 연구는 평면 스캔 비디오카이모그래피를 통해 병리적 성대의 진동 특성을 정량적화 하는 자동화된 방법과 임상적 유용성을 알아보고자 하였다.
제시된 방법은 동적 윤곽추출 모델과 유전 알고리즘을 결합하여 검출 정밀도와 처리 속도를 향상시키는 이미지 처리를 기반으로, 2D VKG의 진동 주기를 정확하게 추출 할 수 있게 하였다. 후처리된 2D VKG 영상은 자동화된 5 가지 매개 변수(fundamental frequency: F0, open quotient: OQ, closed quotient: CQ, phase symmetry index: PSI, amplitude symmetry index: ASI)를 통해 객관적인 값으로 계산할 수 있었다. 본 연구에서는 1주, 3주 및 4 주마다 2D VKG 영상 촬영을 통해 급성 후두염이 있는 52세 남성의 성대 회복 양상을 비교하였다.
F0는 발병 1주일 후에는 측정 할 수 없었으나 4주 후 성대 진동이 관찰 된 후 117.24Hz로 측정이 가능하였다. 성대 접촉 정도를 반영하는 CQ는 38%에서 44%로 증가하였으며 OQ는 62%에서 56%로 감소하였다. 마지막으로 성대의 규칙성을 보여주는 PSI는 0.148에서 0.72로, ASI는 0.175에서 0.81로 감소하였다.
본 연구에 사용 된 방법은 성대진동 매개변수를 쉽게 분석하고 정량화 할 수 있다. 성대 진동의 상태를 수치로 제시함으로써 성대 질환 회복을 객관적으로 비교할 수 있어 임상적 유용성이 높아질 것으로 기대된다.
Keywords:
Two dimensional videokymography, quantitative analysis, automated evaluation키워드:
평면 스캔 비디오카이모그래피, 정량화 분석, 자동화 평가Ⅰ. Introduction
Measurement and analysis of vocal cord vibrations is an important aspect of quantitative description and investigation of voice disorders (Doellinger, 2009; Lohscheller et al., 2007). There is an increasing need for a reliable technique to quantify voice problems and to detect dysphonia in clinical practice (Han et al., 2019; Kim, 2019; Yu et al., 2001). Functional dysphonia is a result of inadequate coordination of laryngeal irregularity and movement during phonation (Benninger et al., 1996; Deliyski & Hillman, 2010). As these factors affect only the dynamic behavior and not the static anatomical structures, they can only be recognized during vibration of the vocal cords (Yumoto, 2004). Therefore, recording of the vocal cords during phonation using appropriate techniques is necessary. The data obtained through digital high-speed endoscopy and their objective analysis provide many new possibilities to enhance the understanding and investigation of laryngeal dynamics and related pathologies (Deliyski et al., 2008; Doellinger, 2004). High-speed imaging (HSI) overcomes the disadvantages of videostroboscopy (Inwald et al., 2011). Additionally, objective evaluation of the dynamics allows the beginning of evidence-based approach in endoscopic voice diagnostics (Bohr et al., 2013).
However, vocal cord vibration cannot be quantified with HSI alone. Therefore, post-processing and videokymography (VKG) techniques should be used for quantitative evaluation of vocal cord vibrations (Andrade-Miranda et al., 2015; Bohr et al., 2013; Qiu et al., 2003). Although researchers developed the line-scan VKG system to examine the mucosal wave of the vocal cords located on a fixed line (Švec & Schutte, 1996; Švec et al., 1996), the mucosal wave of the entire vocal cord could not be observed in a single recording. Various imaging techniques have been developed to assess the mucosal wave pattern of the vocal cords. However, each system has its advantages and disadvantages. Hence, these systems are used in a complementary manner in clinical practice (Schutte et al., 1998).
To compensate for the disadvantage of the line-scan VKG, a two-dimensional (2D) VKG was developed that can analyze vocal cords in their entirety. When the vibration pattern of the vocal cords is evaluated using the developed 2D VKG system, two types of vocal cord images (laryngeal endoscopy image and VKG image) are generated (Park et al., 2016; Wang et al., 2016a).
The 2D VKG system allowed the evaluation of the movement of the entire vocal cord in a patient with laryngeal disease over time (Wang et al., 2016b). However, the degree of recovery of laryngeal function over time was subjectively confirmed and could not be expressed in the form of objective data. Denoting the degree of recovery of laryngeal function in a form of a numerical value can provide objective information to patients. Moreover, it may help study the characteristics of the disease.
Vibration of the vocal cords is an essential part of voice production. Thus, a method for quantifying vibration is essential for the detection, diagnosis, and treatment of various laryngeal disorders. The present study describes an automatic quantitative method to obtain the vibration properties of pathological vocal cords via 2D VKG.
Ⅱ. Methods
1. Participants
A 2D VKG system (Wang et al., 2016b) was used for post-processing of the 2D VKG image. The volunteer who participated in this study was a 52-year-old man diagnosed with acute laryngitis. In addition, for comparison with normal vocal cords, the authors of this study participated as subjects. The participant diagnosed with acute laryngitis underwent 2D VKG at 1, 3, and 4 weeks to compare the degree of recovery.
2. Experimental Design
For post-processing of the 2D VKG data, the stored still image was not used, but a new method was used to detect the kymogram edge using video. To analyze the 2D VKG video in real time, it was divided into image processing steps as follows. Initially, the HSV (hue, saturation, value) color model conversion was used to improve image reliability (Park, 2001). After converting the image to grayscale, blurring the image by a Gaussian profile was performed to improve the reflection of a strong light source due to liquid secretions in the vocal cords (Hamerly & Dvorak, 1981). Subsequently, Otsu’s method using binarization was used to determine the image threshold and to separate the edge regions (Sahoo & Arora, 2004). Finally, connected component labeling was used to divide and to display each independent area of the image according to its own label value (Dillencourt et al., 1992).
The proposed method is based on image processing, which combines an active contour model with a genetic algorithm (Qui et al., 2003) to improve the detection accuracy and processing speed. It can accurately extract the vibration wave in 2D videokymograms and automatically quantify the vibration properties in terms of five typical parameters (fundamental frequency [F0], open quotient [OQ], closed quotient [CQ], phase symmetry index [PSI], and amplitude symmetry index [ASI], Figure 1).
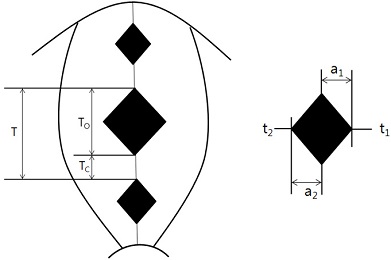
The calculating method of characteristic parameters in a typical 2D scanning VKG image Note. T=vibration period of cycles; To, Tc=open and closed duration of the glottis; a1, a2=open amplitude of the left and right vocal cords; t1, t2=moments when the left and right vocal cords reach the maximum open amplitude, respectively, in the same cycle.
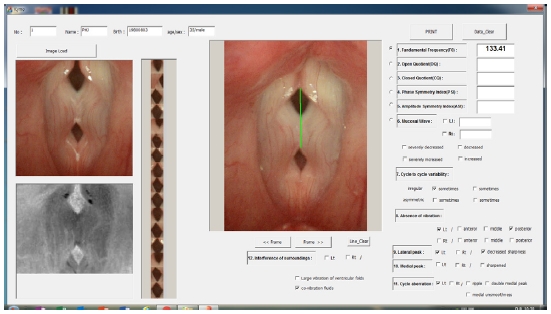
Fundamental frequency is the number of cycles per second. In 2D VKG imaging, it was calculated by multiplying the number of frames per second (30 frames) by the ratio of the length of the entire screen and the length of one cycle (Figure 2).
| (1) |
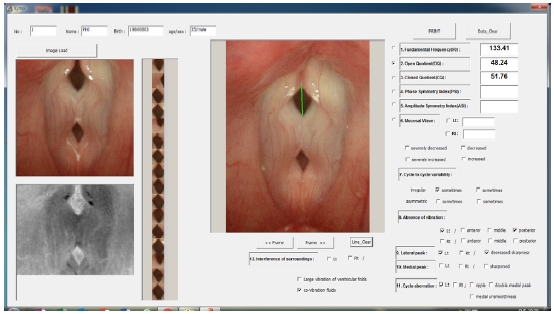
OQ is the percentage of time in the vibrating period of the vocal cords while the glottis is open. OQ is calculated by dividing the total vocal cord vibration period by the duration for which the glottis is open. Closed quotient (CQ) is the percentage of time in the vibrating period of the vocal cords while the glottis is closed. CQ is calculated by dividing the total vocal cord vibration period by the duration for which the glottis is closed (Figure 3).
| (2) |
| (3) |
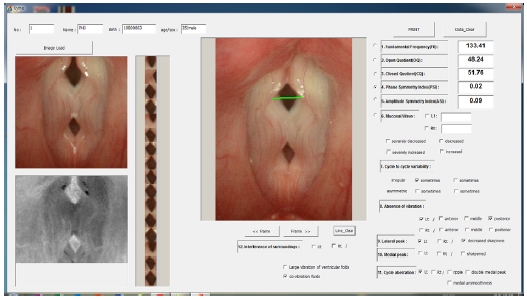
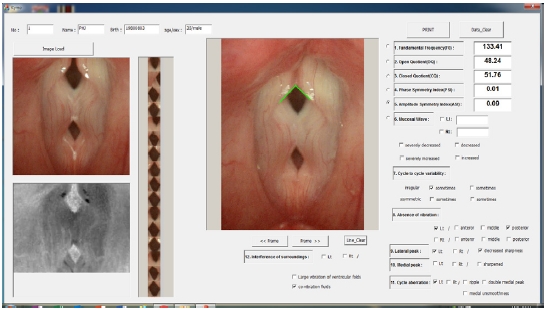
PSI is obtained by dividing the phase difference between the vocal cords by the entire vibration period of the vocal cords (Figure 4). Referring to Figure 2, the PSI can be expressed as an equation as follows. PSI value ranges from -1 to 1 and values closer to 0 indicate greater regularity of vocal cord vibration.
| (4) |
Ⅲ. Results
1. 2D VKG Image According to Vocal Cord Disease Progression
2D VKG was recorded and analyzed at 1, 3, and 4 weeks after the treatment to observe the changes in vocal cord vibration according to the recovery of the subject with acute laryngitis. Changes in the treatment results of patients with acute laryngitis were confirmed through 2D VKG imaging (Figure 6).
2. Quantitative Analysis Through Post-Processing of 2D VKG Imaging
Vocal cord vibrations of the subject with acute laryngitis were quantitatively analyzed through 2D VKG imaging at 1, 3, and 4 weeks. Table 1 shows the results of the analysis using the software developed in this study in to objectively verify whether vocal cord vibration was restored in patients with acute laryngitis. Measurement of F0 was not possible at 1~3 weeks of acute laryngitis, but it could be measured after 3 weeks and the value was 117.28 Hz. F0 was impossible to measure initially due to the lack of complete contact between the vocal cords at 1~2 weeks. Subsequently, with improved contact between the vocal cords, objective measurement was possible. CQ increased from 38% at 3 weeks after the onset of acute laryngitis to 44% at 4 weeks. Based on the same principle, OQ exhibited a decrease with time from 62% to 56%. PSI, which can objectively measure the regularity of the vocal cord vibration cycle, exhibited approximately 50% decrease from 0.135 at 1 week to 0.072 at 4 weeks. ASI exhibited approximately 50% decrease from 0.175 to 0.081.
Ⅳ. Discussion
Since vocal cord vibration cannot be visualized with naked eyes, a variety of equipment is used to visualize it. Such equipment includes laryngeal endoscopes (Dailey et al., 2007), laryngeal stroboscopes (Mehta et al., 2010), and high-speed imaging devices (Yan et al., 2005). These devices provide the advantage of visualizing vocal cord vibrations to identify various vocal cord disorders. However, they provide only an image of the vocal cord vibration. Therefore, since vocal cord diseases are subjectively evaluated based on the image data, there may be differences among evaluators and it is difficult to detect subtle changes.
With increasing emphasis on the importance of quantitative evaluation of vocal cord vibrations, studies on objective evaluation through post-processing of the existing acquired images are being conducted (Manfredi et al., 2012). Recently, a quantification study using line-scan videokymograpy has been published (Jiang et al., 2008). Line-scan videokymograpy can analyze a part of the entire vocal cord using a high-speed laryngeal imaging device. However, it cannot quantify the movement of the entire vocal cord.
The 2D VKG system makes it possible to record the mucosal wave pattern of the entire vocal cord in a single session. Although further studies are required to confirm its clinical efficacy for the evaluation of vocal cords, it can be used to evaluate the static and the dynamic status of vocal cords in patients with vocal cord diseases (Park et al., 2016). Kim et al. (2017) used real-time visualization of 2D VKG for evaluation of vocal cord vibration to quantitatively analyze (ASI, PSI, OQ, CQ) vocal cord images of normal adults.
Additionally, a system has been developed that can post-process HSI images to obtain 2-D digital kymography (2D DKG) images (Kang et al., 2017; Lee et al., 2019). 2D DKG can be used for quantitative analysis of vocal folds in cases of atrophic vocal folds (Bae et al., 2019a), vocal fold scarring (Kim et al., 2019a), diplophonia (Bae et al., 2019b), and inhalation burns of the larynx (Kim et al., 2019b). However, previous studies reported a two-step process in which HSI images were post-processed into DKG images and then quantitatively evaluated again. The method described in the present study is advantageous, as quantitative analysis can be performed automatically in a single-step process using 2D VKG images that can view the entire vocal cord in real time and the need for DKG image conversion is avoided.
In the present study, clinical usefulness of 2D VKG was confirmed by quantitatively measuring changes in the vocal cords of the subject with vocal cord disease. Vocal cords with acute laryngitis were photographed with a 2D VKG system and the image data obtained through post-processing were analyzed and quantified. During the course of recovery from acute laryngitis, the values of F0, CQ, OQ, PSI, and ASI, which can objectively confirm the vibrational pattern of the vocal cords, exhibited improvements. In addition, subtle changes could be detected by presenting the degree of recovery of the vocal cord vibration in a form of an accurate value.
Objective comparison is difficult, as no previous studies have measured the change in pathological vocal cords using 2D VKG. However, the quantified value of vocal cord vibration following recovery from acute laryngitis can be of great clinical significance. In the future, it might be useful for the evaluation of organic diseases of acute laryngitis as well as of various functional voice disorders such as spasmodic dysphonia, conversion dysphonia, presbyphonia, and puberphonia.
Reference
-
Andrade-Miranda, G., Godino-Llorente, J. I., Moro-Velázquez, L., & Gómez-García, J. A. (2015). An automatic method to detect and track the glottal gap from high speed videoendoscopic images. Biomedical Engineering Online, 14(1), 100.
[https://doi.org/10.1186/s12938-015-0096-3]

-
Bae, I. H., Wang, S. G., Lee, J. C., Sung, E. S., Kim, S. T., Lee, Y. W., . . . Wang, Y. J. (2019a). Efficacy of two-dimensional scanning digital kymography in evaluation of atrophic vocal folds. Journal of Voice, 33(4), 554-560.
[https://doi.org/10.1016/j.jvoice.2017.12.011]

-
Bae, I. H., Wang, S. G., Kwon, S. B., Kim, S. T., Sung, E. S., & Lee, J. C. (2019b). Clinical application of two-dimensional scanning digital kymography in discrimination of diplophonia. Journal of Speech, Language, and Hearing Research, 62(10), 3643-3654.
[https://doi.org/10.1044/2019_JSLHR-S-18-0175]

-
Benninger, M. S., Alessi, D., Archer, S., Bastian, R., Ford, C., Koufman, J., . . . Woo, P. (1996). Vocal fold scarring: Current concepts and management. Otolaryngology Head and Neck Surgery, 115(5), 474-482.
[https://doi.org/10.1016/S0194-5998(96)70087-6]

- Bohr, C., Kraeck, A., Eysholdt, U., Ziethe, A., & Döllinger, M. (2013). Quantitative analysis of organic vocal fold pathologies in females by high‐speed endoscopy. The Laryngoscope, 123(7), 1686-1693.
-
Dailey, S. H., Spanou, K., & Zeitels, S. M. (2007). The evaluation of benign glottic lesions: Rigid telescopic stroboscopy versus suspension microlaryngoscopy. Journal of Voice, 21(1), 112-118.
[https://doi.org/10.1016/j.jvoice.2005.09.006]

-
Deliyski, D. D., & Hillman, R. E. (2010). State of the art laryngeal imaging: Research and clinical implications. Current Opinion in Otolaryngology & Head and Neck Surgery, 18(3), 147.
[https://doi.org/10.1097/MOO.0b013e3283395dd4]

-
Deliyski, D. D., Petrushev, P. P., Bonilha, H. S., Gerlach, T. T., Martin-Harris, B., & Hillman, R. E. (2008). Clinical implementation of laryngeal high-speed videoendoscopy: Challenges and evolution. Folia Phoniatrica et Logopaedica, 60(1), 33-44.
[https://doi.org/10.1159/000111802]

-
Dillencourt, M. B., Samet, H., & Tamminen, M. (1992). A general approach to connected-component labeling for arbitrary image representations. Journal of the ACM (JACM), 39(2), 253-280.
[https://doi.org/10.1145/128749.128750]

-
Doellinger, M. (2009). The next step in voice assessment: High-speed digital endoscopy and objective evaluation. Current Bioinformatics, 4(2), 101-111.
[https://doi.org/10.2174/157489309788184774]

-
Hamerly, J. R., & Dvorak, C. A. (1981). Detection and discrimination of blur in edges and lines. Journal of Optical Society of America, 71(4), 448-452.
[https://doi.org/10.1364/JOSA.71.000448]

-
Han, D. B., Ju, S. R., & Yoo, J. Y. (2019). A study of correlation between ADSV and MDVP voice parameter. Journal of Speech-Language & Hearing Disorders, 28(4), 65–72.
[https://doi.org/10.15724/jslhd.2019.28.4.065]

-
Inwald, E. C., Döllinger, M., Schuster, M., Eysholdt, U., & Bohr, C. (2011). Multiparametric analysis of vocal fold vibrations in healthy and disordered voices in high-speed imaging. Journal of Voice, 25(5), 576-590.
[https://doi.org/10.1016/j.jvoice.2010.04.004]

- Jiang, J. J., Zhang, Y., Kelly, M. P., Bieging, E. T., & Hoffman, M. R. (2008). An automatic method to quantify mucosal waves via videokymography. The Laryngoscope, 118(8), 1504-1510.
-
Kang, D. H., Wang, S. G., Park, H. J., Lee, J. C., Jeon, G. R., Choi, I. S., . . . Shin, B. J. (2017). Real-time simultaneous DKG and 2D DKG using high-speed digital camera. Journal of Voice, 31(2), 247E1-247E7.
[https://doi.org/10.1016/j.jvoice.2016.08.005]

-
Kim, G. H., Lee, Y. W., Bae, I. H., Park, H. J., Wang, S. G., & Kwon, S. B. (2019a). Usefulness of two-dimensional digital kymography in patients with vocal fold scarring. Journal of Voice, 33(6), 906-914.
[https://doi.org/10.1016/j.jvoice.2018.06.003]

- Kim, G. H., Wang, S. G., Lee, Y. W., & Kwon, S. B. (2019b). Voice recovery in a patient with inhaled laryngeal burns. Iranian Journal of Otorhinolaryngology, 31(102), 55.
-
Kim, G. H., Wang, S. G., Lee, B. J., Park, H. J., Kim, Y. C., Kim, H. S., . . . Kwon, S. B. (2017). Real-time dual visualization of two different modalities for the evaluation of vocal fold vibration–Laryngeal videoendoscopy and 2D scanning videokymography: Preliminary report. Auris Nasus Larynx, 44(2), 174-181.
[https://doi.org/10.1016/j.anl.2016.06.008]

-
Kim, J. O. (2019). Meta-analysis of semi-occluded vocal tract exercise studies on subjective voice evaluation. Journal of Speech-Language & Hearing Disorders, 28(2), 1–11.
[https://doi.org/10.15724/jslhd.2019.28.2.001]

-
Lee, J. C., Wang, S. G., Sung, E. S., Bae, I. H., Kim, S. T., & Lee, Y. W. (2019). Clinical practicability of a newly developed real-time digital kymographic system. Journal of Voice, 33(3), 346-351.
[https://doi.org/10.1016/j.jvoice.2017.10.024]

-
Lohscheller, J., Toy, H., Rosanowski, F., Eysholdt, U., & Döllinger, M. (2007). Clinically evaluated procedure for the reconstruction of vocal fold vibrations from endoscopic digital high-speed videos. Medical Image Analysis, 11(4), 400-413.
[https://doi.org/10.1016/j.media.2007.04.005]

-
Manfredi, C., Bocchi, L., Cantarella, G., & Peretti, G. (2012). Videokymographic image processing: Objective parameters and user-friendly interface. Biomedical Signal Processing and Control, 7(2), 192-201.
[https://doi.org/10.1016/j.bspc.2011.02.007]

-
Mehta, D. D., Deliyski, D. D., & Hillman, R. E. (2010). Commentary on why laryngeal stroboscopy really works: Clarifying misconceptions surrounding Talbot’s law and the persistence of vision. Journal of Speech, Language, and Hearing Research, 53(5), 1263-1267.
[https://doi.org/10.1044/1092-4388(2010/09-0241)]

-
Park, H. J., Cha, W., Kim, G. H., Jeon, G. R., Lee, B. J., Shin, B. J., . . . Wang, S. G. (2016). Imaging and analysis of human vocal fold vibration using two-dimensional (2D) scanning videokymography. Journal of Voice, 30(3), 345-353.
[https://doi.org/10.1016/j.jvoice.2015.05.012]

-
Park, Y. (2001). Shape-resolving local thresholding for object detection. Pattern Recognition Letters, 22(8), 883-890.
[https://doi.org/10.1016/S0167-8655(01)00034-4]

-
Qiu, Q., Schutte, H. K., Gu, L., & Yu, Q. (2003). An automatic method to quantify the vibration properties of human vocal folds via videokymography. Folia Phoniatrica et Logopaedica, 55(3), 128-136.
[https://doi.org/10.1159/000070724]

-
Sahoo, P. K., & Arora, G. (2004). A thresholding method based on two-dimensional Renyi's entropy. Pattern Recognition, 37(6), 1149-1161.
[https://doi.org/10.1016/j.patcog.2003.10.008]

- Schutte, H. K., Švec, J. G., & Šram, F. (1998). First results of clinical application of videokymography. The Laryngoscope, 108(8), 1206-1210.
-
Švec, J. G., & Schutte, H. K. (1996). Videokymography: High-speed line scanning of vocal fold vibration. Journal of Voice, 10(2), 201-205.
[https://doi.org/10.1016/S0892-1997(96)80047-6]

-
Švec, J. G., Schutte, H. K., & Miller, D. G. (1996). A subharmonic vibratory pattern in normal vocal folds. Journal of Speech, Language, and Hearing Research, 39(1), 135-143.
[https://doi.org/10.1044/jshr.3901.135]

-
Wang, S. G., Park, H. J., Cho, J. K., Jang, J. Y., Lee, W. Y., Lee, B. J., . . . Cha, W. (2016a). The first application of the two-dimensional scanning videokymography in excised canine larynx model. Journal of Voice, 30(1), 1-4.
[https://doi.org/10.1016/j.jvoice.2014.09.029]

-
Wang, S. G., Park, H. J., Lee, B. J., Lee, S. M., Ko, B., Lee, S. M., & Park, Y. M. (2016b). A new videokymography system for evaluation of the vibration pattern of entire vocal folds. Auris Nasus Larynx, 43(3), 315-321.
[https://doi.org/10.1016/j.anl.2015.10.002]

-
Yan, Y., Ahmad, K., Kunduk, M., & Bless, D. (2005). Analysis of vocal-fold vibrations from high-speed laryngeal images using a Hilbert transform-based methodology. Journal of voice, 19(2), 161-175.
[https://doi.org/10.1016/j.jvoice.2004.04.006]

-
Yu, P., Ouaknine, M., Revis, J., & Giovanni, A. (2001). Objective voice analysis for dysphonic patients: A multiparametric protocol including acoustic and aerodynamic measurements. Journal of Voice, 15(4), 529-542.
[https://doi.org/10.1016/S0892-1997(01)00053-4]

-
Yumoto, E. (2004). Aerodynamics, voice quality, and laryngeal image analysis of normal and pathologic voices. Current Opinion in Otolaryngology & Head and Neck Surgery, 12(3), 166-173.
[https://doi.org/10.1097/01.moo.0000122306.42961.44]

