Evaluation of Two Methods for Graphically Representing Emotional Content in Functional Phrases

Copyright 2025 ⓒ Korean Speech-Language & Hearing Association.
This is an Open-Access article distributed under the terms of the Creative Commons Attribution Non-Commercial License (http://creativecommons.org/licenses/by-nc/4.0) which permits unrestricted non-commercial use, distribution, and reproduction in any medium, provided the original work is properly cited.
Abstract
The purpose of this study was to evaluate two methods to represent emotional content in functional phrases in Augmentative and Alternative Communication systems.
Forty participants were asked to match either a set of line-drawn manikins (Self-Assesment Manikin: SAM) or stylized typographic phrases to the voices recorded according to different emotional states in three dimensions of the Pleasure-Arousal-Dominance emotional state model. The participants completed three experiments. They also responded to survey questions to provide their opinions, strategies, and what could be added to represent the emotions and benefits of the two methods at the end of the experiments. In the application task, the participants expressed their possible emotions based on the given situations using the SAM and stylized typographic phrases.
Participants matched a manikin or a stylized typographic phrase to a voice with an average of 80% accuracy. There was no significant difference in the accuracy between the two methods. However, 80% of participants preferred the SAM to the stylized typographic cue. The participants selected background color as the most helpful feature in the SAM task, whereas they selected punctuation in the stylized typographic phrase task. In both tasks, focusing on acoustic features was reported as the most frequently used strategy to match each representation to the voices.
The new methods introduced in this study can be useful tools for conveying emotional content, depending on the method’s specific benefits or the AAC user's preferences.
Keywords:
Augmentative and alternative communication, representation of emotion, stylized phrase, typographyⅠ. Introduction
People with severe disabilities who cannot use speech as their main means of communication may benefit from using other techniques to express themselves. Augmentative and alternative communication (AAC) systems include gestures, alphabet boards, writing/written words, picture exchange communication systems, and computer-based devices with voice output. AAC systems can enhance people’s access to educational and social opportunities (Millar & Scott, 1998; Von Tetzchner & Basil, 2011).
Speech-generating devices (SGDs) are an expressive modality used by individuals with complex communication needs (CCN) to meet their functional speaking needs during social interactions (Higginbotham, 2010). The translation of words into synthesized speech output can vary in its success based on many factors related to technology, timing, the environment, and the individuals involved. The performance of synthesized speech systems as technology can be measured with three features, including intelligibility, variability, and naturalness (Murray et al., 1996). With the advance of software-based speech synthesis (e.g., deep learning-based text-to-speech synthesis), natural-sounding voices with variability have been available in recent years (Barakat et al., 2024; Higginbotham, 2010; Um et al., 2020). However, digital literacy among older adults (Hwang et al., 2020) and people with disabilities remains a concern (Lee & Lee, 2018).
Emotions are essential elements of communication on personal and social occasions (Fallon et al., 2001). Words as available can be used to label an emotion (e.g., “I feel sad”) or to clarify (e.g., “I was being sarcastic”) and individuals who are using AAC systems need to be able to express their emotions. Although there are emotional representations widely used in AAC systems, a specific emotional state can be difficult to represent visually and to identify through graphic symbols in particular. Also, many individuals using AAC systems seem to have difficulty discriminating among visual representations of emotional states (Wilkinson & Snell, 2011).
Previous research stated that individuals who use AAC systems may benefit from the addition of graphical symbols and / or orthographic symbols (Beukelman et al., 2007; Light & Drager, 2007). Numerous adjectives are used to describe emotions, environmental perception, experiences, and perceived qualities (Bakker et al., 2014). However, it is practically difficult to input all adjectives as symbols in AAC systems. Also, there is still a need to explore tools to convey specific levels of emotion in AAC systems.
1. PAD model
An alternative solution is the pleasure, arousal, and dominance (PAD) emotional state model to express different states of emotion. Mehrabian & Russell (1974) developed three independent dimensions: pleasure, arousal, and dominance to describe and measure people’s state of feeling. The pleasure-displeasure dimension indicates how pleasant an emotion may be. For example, anger is an unpleasant emotion and scores high on the displeasure side, whereas happiness scores high on the pleasure side. The arousal-nonarousal dimension represents the intensity of the emotion, ranging from sleep to frantic excitement. For example, both anger and rage are unpleasant emotions. However, rage has a higher intensity than anger. Boredom could be an unpleasant emotion meanwhile, it has a low arousal score. Lastly, the dominance-submissiveness dimension indicates the controlling and dominant nature of the emotion. For instance, both fear and anger score on the unpleasant side. However, anger is a dominant emotion, whereas fear is a submissive emotion (Mehrabian, 1980, 1996).
The PAD model has been used in assessing the emotions associated with social media (Hall et al., 2017), website aesthetics (Chang et al., 2014), and the design of animated characters expressing emotions in the virtual world (Becker et al., 2007). There is a graphic representation of the dimensions of the PAD model in the Self-Assessment Manikin (SAM, Bradley & Lang, 1994). The SAM is a picture-oriented scaled instrument to assess the pleasure, arousal, and dominance associated with response to a variety of situations, including reactions to sounds, pictures, and advertisements (Bradley & Lang, 1994). As the SAM has a non-verbal rating system, it is usable regardless of different linguistic backgrounds based on language, age, and culture (Bradley & Lang, 1994). The SAM has been used to measure emotions in response to various targets in other studies (Becker et al., 2007; Chang et al., 2014; Hall et al., 2017). The validated graphic dimensions of the scale lead to possible applications for AAC systems. In the current study, this tool itself was proposed as a graphical symbol to convey the emotional content of short, frequently used sentences. Since it was not designed for such a purpose and in an effort to explore other means of representing emotional content, other adaptations were also considered.
2. Acoustic features of emotional speech
Individuals who are unable to speak but are literate may also want to understand or express more subtle aspects of spoken language through written language. With spoken language, people vary their speech loudness, pitch, and rate to express a desired emotion. However, currently, there is a lack of options for individuals requiring AAC systems to make emotional distinctions in their messages beyond basic declarative vs. interrogatives. In social media environments, emoticons or text acronyms (e.g., LOL) can be added to clarify the emotional intent of a message. However, emoticons or text acronyms cannot represent the tone of voice or intensity of emotion of the speaker (Lee et al., 2006). Thus, there is a need for research to explore a tool that effectively conveys levels of emotion through text for people using AAC systems.
Such a tool would need to manage the relationship between acoustic features and emotions to design text conveying emotional content (Apple et al., 1979; Scherer, 1974). Apple et al. (1979) identified that alteration in pitch and speech rate could impact judgments of a speaker’s emotional state. For example, high-pitched sounds were judged less truthful, less persuasive, weaker, and more nervous. In addition, speaking slowly was judged to be less truthful, fluent, emphatic, serious, and persuasive, and more passive but more potent. Scherer (1974) also reported that emotions were communicated by specific patterns of acoustic features. The researcher suggested that pitch variation and tempo of speech seemed to influence the listener’s judgment. Fast tempo was related to highly active and potent emotions (e.g., interest, anger, and happiness). On the other hand, speech with a slow tempo was perceived as sadness, disgust, and boredom. These findings show that a specific emotional state has particular acoustic features.
Hennig et al. (2012) investigated whether listeners could differentiate voices that had variations in voice qualities (i.e., pitch and intensity) and whether listeners differently perceived AAC users’ synthesized speech with the variations from speech without variations in a given situation. The authors reported that listeners rated synthesized speech with the variations more appropriate and effective in a given situation than synthesized speech without the variations (Hennig et al., 2012). Also, the listeners highly rated synthesized speech as having variations even though the sound of speech did not match with a given situation compared to synthesized speech without the variations. This study suggested that listeners not only distinguished synthesized voices with even subtle variations in voice quality but also perceived AAC users who used the synthesized speech with variations more positively.
3. Typographic features to index acoustic features
Variations in acoustic features of emotional speech can potentially be represented by changes in typographic features. However, there do not exist any conventions for doing so in AAC systems. Typographic features include font size, color, style (i.e., bold or Italic), position, and spacing between words (Waller, 1989). Typography can enrich the visual communication features of written language. There is some precedent for using typographic variations to signal differences in screen readers. Previous studies reported that typographic features can express voice quality and linguistic features such as pitch, loudness, and speech rate (Ford et al., 1997; Forlizzi et al., 2003; Katsoulis & Kourpupetoglou, 2015; Waller, 1989; Wong, 1996). Katsoulis and Kourpupetoglou(2015) identified the relationship between font size and voice loudness in text-to-speech. The participants consistently matched the louder speech to the bigger font. In addition, research in media and linguistics has demonstrated that changes in typographic features can express emotion (Ford et al., 1997; Forlizzi et al., 2003; Waller, 1989; Wong, 1996). Based on the previous research, typography can be considered a useful tool to convey emotion in communication and has the potential to be applied to AAC systems.
Potentially, typographic features can be combined with an utterance-based system in the SGDs. An utterance-based system provides pre-constructed words and storage of whole extended utterances for use in future interaction (Todman et al., 2008). It has been reported that a higher conversational rate by using an utterance-based system was related to a positive perception of AAC users’ personal characteristics and communicative competence (Hoag et al., 2008; Todman, 2000; Todman & Lewins, 1996; Todman et al., 2008). Moreover, an utterance-based system enabled AAC users to access coherent and relevant messages during a conversation (Todman et al., 2008).
In reviewing the literature on attitudes toward people who use AAC, McCarthy & Light (2005) suggested that when individuals using AAC produce slow and short responses, they may be perceived as less interesting and less intelligent than they really are. It may result in limited opportunities for the formation of meaningful social relationships with others. Todman et al. (2008) suggested that the involvement of commonly used utterances in the system allows AAC users to make quick, relevant responses in social interactions. This can assist AAC users to maintain a flow of conversation through quick responses and appropriate repairs to misunderstandings. In addition, the author suggested that AAC users may benefit from the utterance-based system with a variety of speech stress and intonation in expressing their emotions (Todman et al., 2008). The previous studies stated the benefits of the utterance-based system (Hoag et al., 2008; Todman et al., 2008), and future research needs to represent emotion in the utterance-based system (Todman et al., 2008). However, how to manifest emotion in frequently used utterances has not been studied for future use in AAC systems.
The SAM based on the PAD model and stylized phrases using typographic features has the potential to represent emotion as graphical and orthographic symbols, respectively. However, whether both methods effectively represent different emotional states has not been explored. Thus, the present study examined 1) if participants can accurately apply SAM to represent emotional states in functional phrases with minimal instruction, 2) if participants can accurately apply stylized typographic cues to represent emotional states in functional phrases with minimal instruction, 3) the differences in accuracy between the SAM and stylized typographic phrases identified, 4) the accuracy of participants in applying the systems in given hypothetical scenarios to express emotions, 5) the self-reported strategies participants used to match speech samples with the representation with each system, and 6) the preference of participants related to the two systems.
Ⅱ. Methods
1. Participants
This study was performed with the approval of the institutional review board of Ohio University (IRB: 16-X-324). Forty adults participated in this study. Specific inclusion criteria were as follows, 1) chronological age within a range from 18 to 32 years, 2) a native speaker of American English, 3) within normal limit on auditory screening test, 4) within normal limit on visual screening test (Pelli-Robson contrast sensitivity chart), and 5) no history of speech, language, cognitive, and learning disorder. There were 32 females and 8 males. The mean age was 22.4 years.
2. Stimuli
Sixty phrases consisting of three words were selected from the Nebraska common phrase list to create stimulus materials (University of Nebraska-Lincoln, AAC Laboratory, n.d.). The auditory stimuli were recorded at 44.1 kHz, 32-bit resolution by an adult male native speaker of American English in a sound-treated booth. The speaker was a trained classical singer with theatre experience and experience recording auditory samples. Sound files were low-pass filtered (20 kHz), normalized for intensity, and saved as .wav files. The speaker recorded 60 phrases with varied emotional states based on the Self-Assessment Manikin (SAM) (Bradley & Lang, 1994, Figure 1). Eleven phrases with consistently differentiated distinctions in voices across emotional states were selected for final auditory and visual cue stimuli (Appendix 1).

Self-assessment manikin setNote. The Self-Assessment Manikin (SAM) adapted from Bradley & Lang (1994). The scales of the dominance dimension were reversed to apply this study.
Consistent differentiation was determined through visual inspection of the waveforms for changes in pitch, loudness, and timing done across each of the five states on each of the emotional dimensions of SAM’s emotional state. The SAM represented three emotional dimensions with figures. Each emotional dimension had five states (five figures). For pleasure, the SAM ranged from a smiling, happy figure to a frowning, unhappy figure. Arousal was represented from a wide-eyed figure (excited) to a relaxed sleepy figure (calm). The Dominance dimension was ranged by the size of the figure. A smaller figure meant under control, whereas a larger figure meant controlling a situation (Bradley & Lang, 1994).
The visual cue stimuli included manikins of the SAM and stylized phrases. Acoustic features of each phrase, including pitch, loudness, and rate of speech were obtained using Praat software, version 6.0.19 (Boersma & Weenink, 2016). Typographic rules to represent acoustic features were applied using Adobe Photoshop CS6. The pitch was represented by the height of a phrase. Because voices were recorded based on the five emotional states, a phrase was positioned onto one of five heights (i.e., extreme high pitch voice - 1st row, high pitch voice- 2nd row, neutral pitch voice- 3rd row, low pitch voice- 4th row, and extremely low pitch voice- 5th row). Loudness was represented by transparency (i.e., extremely loud voice - 100% opacity of words; darkest phrase, loud voice- 80% opacity; moderate voice- 60% opacity; soft voice- 40% opacity; and extremely soft voice- 20% opacity; lightest color). The rate of speech was represented by spacing between letters (i.e., extremely fast voice- 0 character spacing; no space between letters, fast voice- 10 character spacing, normal voice- 50 character spacing, slow voice- 75 character spacing, and extremely slow voice- 100 character spacing; wide space between letters). For example, a phrase with an extremely happy state was represented on the first row, with 100% opacity of words and 0 character spacing (Figure 2).

Stylized typographic phrase stimuli
3. Experiments
There were three tasks in the experiment; a SAM task, a stylized typographic phrase task, and an application with feedback task. All tasks were completed in a single session. The order of the first two tasks and the order of SAM dimensions were counterbalanced across participants. The purpose of the tasks was to identify whether participants could accurately apply the SAM and the stylized typographic cues to represent emotional states in functional phrases with minimal instruction. For each visual cue task, a total of 75 questions were presented (a combination of five phrases, three emotional dimensions, and five emotional states in SAM). Participants were allowed to take breaks at any time. An instruction to explain the meaning of manikins and the typographic rules was provided prior to each task.
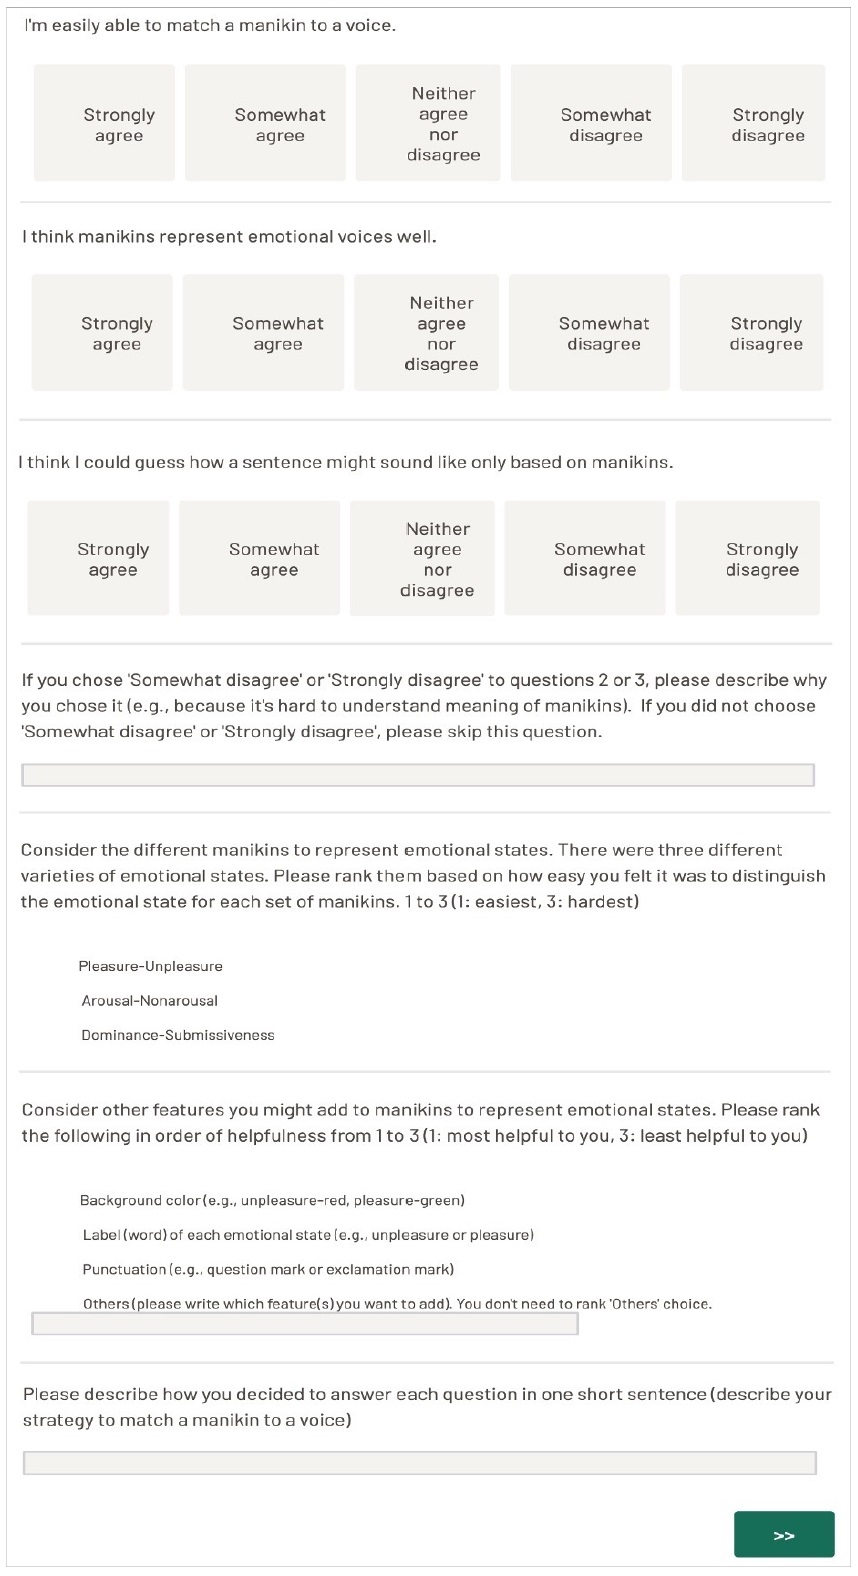
For each question in the SAM task, the participants saw five manikins associated with one of the emotional dimensions. One of the manikins was randomly selected as a target and highlighted on the computer screen. Five recordings with different emotional content were presented as multiple choices using an online survey tool. The participants were asked to choose which of the recordings best matched the highlighted manikin. Their response was recorded, but no feedback was given about the accuracy of their choice. After the task, they completed a 6-item survey. The survey was developed to collect participant’s opinions about the SAM (Appendix 2).
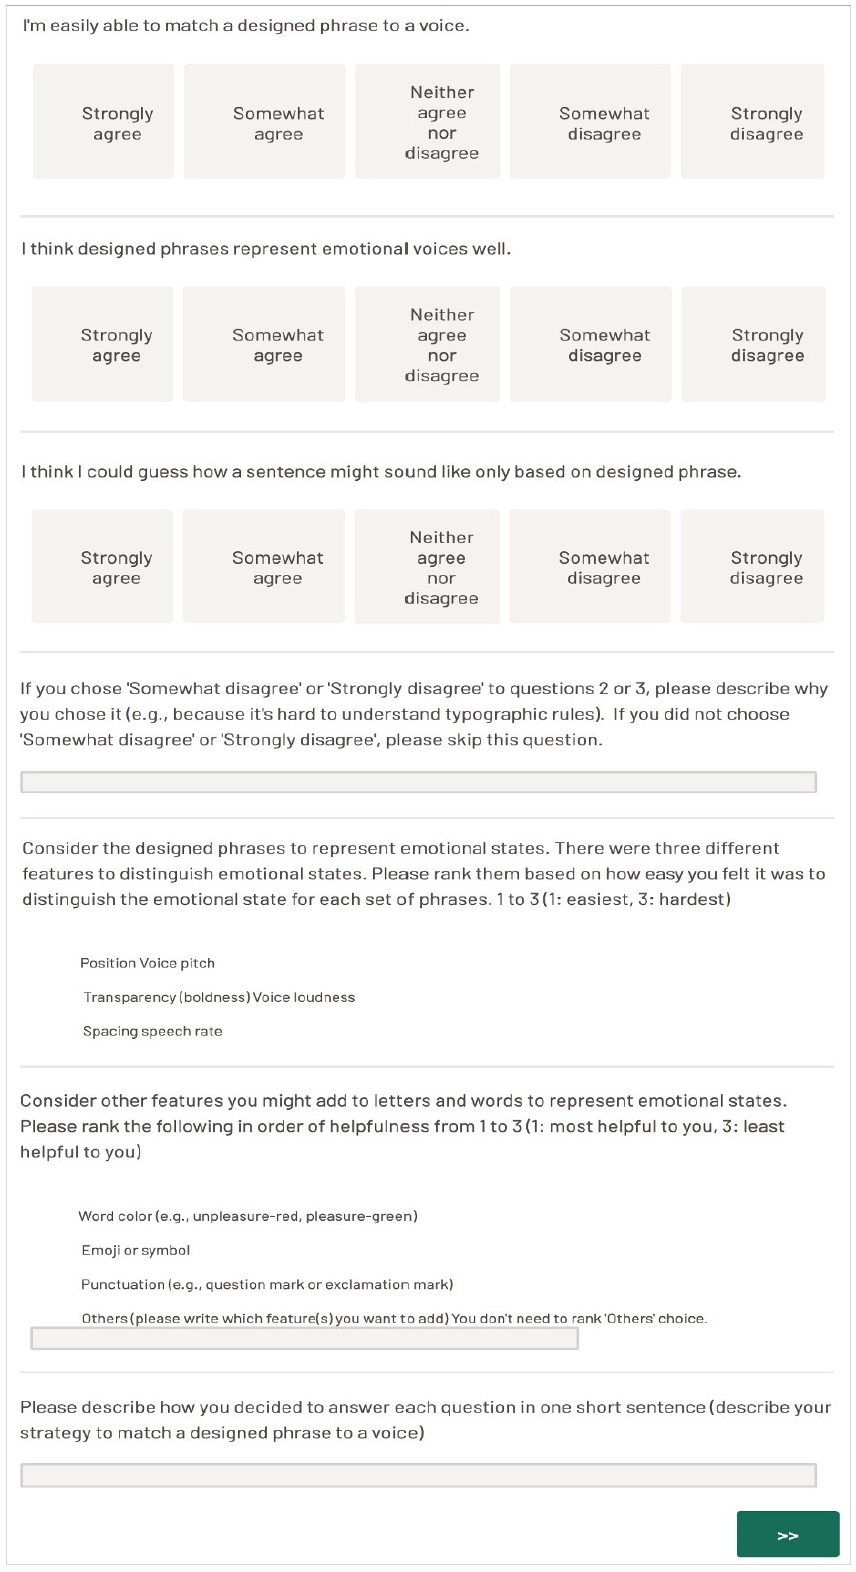
For each question in the stylized typographic phrase task, the participants saw five typographic transcriptions of the spoken sentence with position, spacing, and transparency altered to reflect emotional content. One of the representations was randomly selected and highlighted on the computer screen. Participants were presented with five recordings with different emotional content. They were asked to choose which of the recordings best matched the highlighted typographic representation. Next, they completed a 6-item survey about the typographic representation (Appendix 3).
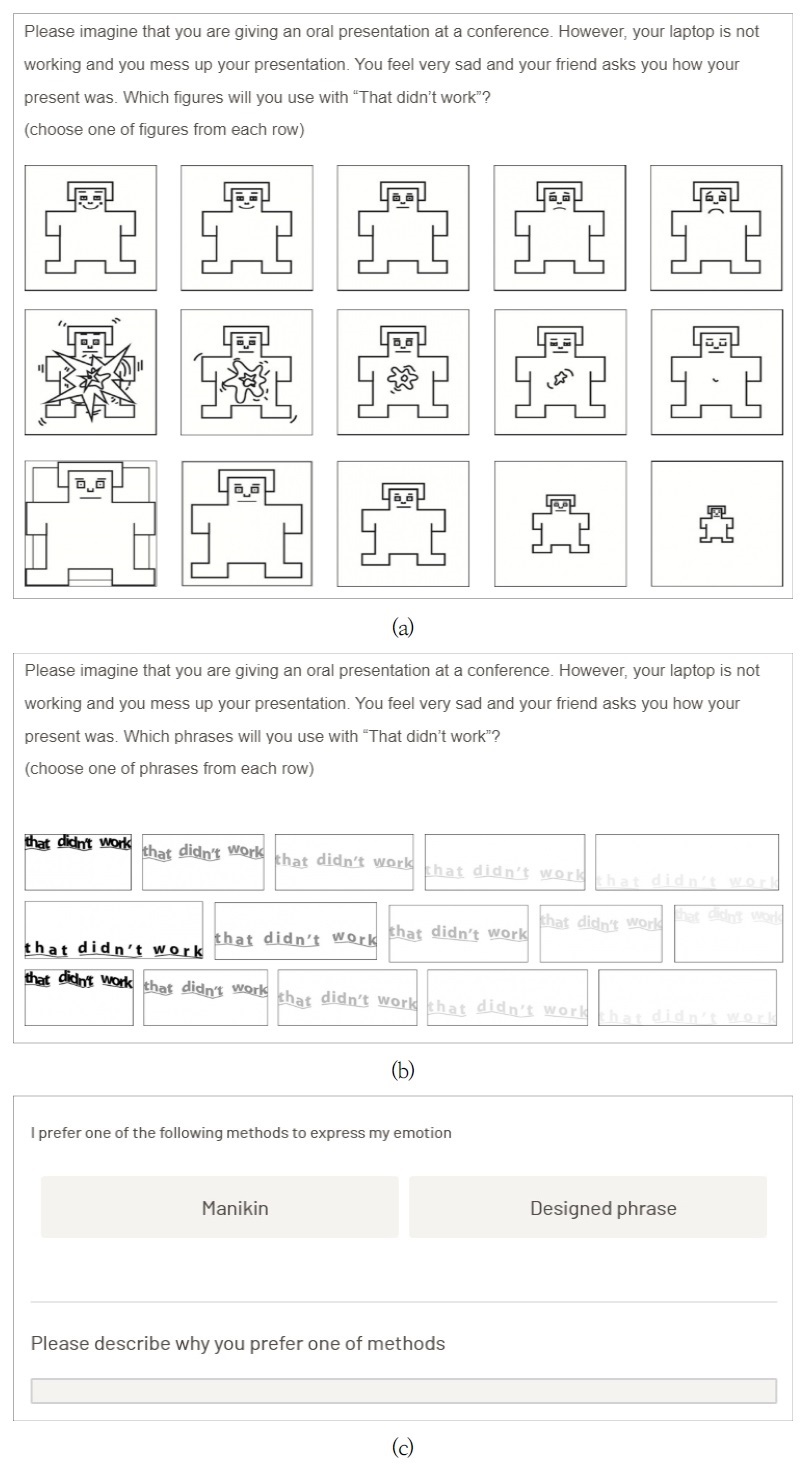
In the third task, six situations were presented. The researcher asked participants which of the methods (SAM and stylized typographic phrase) they would use to express the phrase with their emotions in the given situation. Then, they completed a short survey (Appendix 4). All tasks were presented using computer software (Qualtrics, 2017). Data were analyzed using the SPSS version 22.0 (IBM Corp., 2013). Response accuracy was recorded for the tasks. A paired t-test was used to observe the difference in the accuracy between the two methods. Chi-square analysis was applied to discover significant differences across subscales of the SAM and the stylized typographic phrase task. Responses to the survey questions were analyzed descriptively to report participants’ feedback about the two methods.
Ⅲ. Results
1. Accuracy
Participants matched a manikin or a stylized phrase to a voice with 80% accuracy on average (Table 1). A paired t-test revealed no significant difference in the accuracy between the two methods (t (39)=.303, p=.764). There was a significant difference in the accuracy across sub-dimensions of the SAM and stylized typographic phrase task. The number of errors in the pleasure-displeasure and arousal-calm dimensions was higher in the SAM task than in the stylized typographic phrase task. On the other hand, the number of errors in the dominance-submissiveness dimension was higher in the stylized typographic phrase task than those in the SAM task.

Accuracy of the SAM and stylized typographic phrase tasks
2. Survey responses
Participants were asked for their opinions, strategies, and what could be added to represent the emotions and benefits of the two methods after each task. Most of the participants (more than 80%) not only agreed that two graphic methods represent emotion well but also can match two graphic representations to voices with specific emotional states. Also, they reported that they can speculate how a phrase might sound based on graphic representations.
Participants were asked to rank four features to add to the SAM and stylized typographic phrase tasks in order of most to least helpful. When asked in the SAM task to rank the “most helpful” item, the number of votes for “most helpful” was background color (18), label (13), punctuation (8), and other (1). When asked in the SAM task to rank the “helpful” item, the number of votes for “helpful” was label (15), punctuation (14), and background color (11). When asked in the SAM task to rank the “least helpful” item, the number of votes for “least helpful” was punctuation (18), background color (11), and label (11). Background color was rated as the most helpful feature and punctuation as the least helpful for the SAM task.
When asked in the stylized typographic phrase task to rank the “most helpful” item, the number of votes for “most helpful” was punctuation (18), word color (14), and emoji or symbols (8). When asked in the stylized typographic phrase task to rank the “helpful” item, the number of votes for “helpful” was emoji or symbols (17), punctuation (13), and word color (10). When asked in the stylized typographic phrase task to rank the “least helpful” item, the number of votes for “least helpful” was emoji or symbols (19), word color (19), punctuation (9), other (2 - duration time for each sentence, different font type). Punctuation was rated as the most helpful feature and emoji or symbols as the least helpful for the stylized typographic phrase task.
Participants were asked to report strategies for them to match the graphic representation to a voice with different emotional states through open questions in the survey. In the SAM task, the strategy most frequently used was focusing on acoustic features (52%) (e.g., using pitch, loudness, rate of speech) followed by identifying the extremes (20%), focusing on manikin’s characteristics (14%), and listening repetitively (14%). In the stylized typographic phrase task, focusing on acoustic features (44%) was the most frequently used strategy, as shown in the SAM task. The second most used strategy was focusing on typographic features (28%). Specifically, participants reported that the transparency of letters representing loudness and phrase position representing pitch were useful for matching stylized phrases to voices during the task. The third most used strategy was identifying the extremes (12%), followed by listening repetitively (7%) and others (9%).
In the application task, participants can partially apply manikin and stylized typographic cues to express emotions in the given situations. The percent of correction, in which participants selected a manikin or a stylized typographic phrase that we expected, was 40% (8/18) in the SAM task and 50% (9/18) in the stylized typographic phrase task. The percent of correction having just one emotional state difference from the target (e.g., third manikin / stylized phrase was a target, but a participant selected either second or fourth manikin/stylized phrase) was 80% (15/18) in the task, and 70% (13/18) in the stylized typographic phrase task.
Additionally, it was identified whether the state of the manikin most frequently chosen by the participants matched that of the stylized phrase in the given situation of the application task. Nine of 18 selections were the same between the manikin and stylized phrase, and seven selections had only one level difference in the emotional state.
80% of participants preferred the SAM to the stylized typographic cue. The benefits of the SAM reported by participants included being easy to remember, visualize, recognize, and classify emotional states and looking more natural and intuitive. For the stylized typographic phrase, participants noted that they could guess voice and emotion by reading phrases without memorizing the meaning of the figure and easily visualize emotional voice. Also, they reported that typographic rules were easy to understand and may be customized depending on emotional state.
Ⅳ. Discussion and Conclusion
This study introduced two methods to represent emotions with functional phrases graphically. A high level of accuracy with minimal instruction indicated that people can learn and use the SAM and stylized typographic cues in a short time.
Previous research studying emotional symbols in the AAC system has focused on whether each symbol could indicate primary emotions (Kang et al., 2019; Lee & Shin, 2020). The primary emotions, including fear, anger, pleasure, and unpleasure, etc., refer to the emotions that exist across all cultures, emerging early in development and combined with patterns of physiological change (Kemper, 1987; Ortony & Turner, 1990). On the other hand, the manikins of SAM in this study displayed a level of emotion classifying the three dimensions. The accuracy of the SAM task suggested that the manikins can be used for an individual to express a subtle level of emotion instead of selecting one single symbol.
There was a significant difference in the accuracy across sub-dimensions of the SAM task and stylized typographic phrase task. The number of errors in the pleasure-displeasure and arousal-calm dimensions with the SAM task was higher than with the stylized typographic phrase task. Kong et al. (2011) stated that transmission of pitch and prosodic information was critical for a listener to recognize the emotion of a speaker. The results of this study may reflect that the rules representing acoustic features of the two dimensions in the typographic phrase were more helpful in recognizing subtle emotional states as compared to the SAM features. This result can be seen as consistent with the participant’s survey responses. The participants reported that transparency of letters, phrase position, and spacing between letters were useful strategies to match stylized typographic phrases to voices.
In the stylized typographic task, the reason that the participants showed more errors in the dominance-submissive dimension may be because typographic rules to represent the dominance reversed as compared to the other two dimensions. In other words, a voice with the extreme dominant state has a low pitch, loud, and slow rate of speech, so it is stylized with the lowest height, darkest letter, and wide spaces between letters. On the other hand, a voice with an extreme pleasure/arousal state has a high pitch, loud, fast rate of speech stylized with the highest position, darkest letter, and narrow spaces between letters. Therefore, the different acoustic features with emotional dimensions might confuse the participants.
In the application task, about half of the corrections were achieved in the SAM task and the stylized typographic phrase task. Due to differences in personality and psychological factors, individuals express and perceive emotions with varying intensity and loudness even in identical situations (Gross & John, 2003; Scherer, 2005). Therefore, the percentage of correction could be low even though each situation in the application task was arbitrarily set with a specific level of emotion.
The highest selected level of each dimension with the SAM was similar to the stylized typographic phrase in a given situation. This result implicated that the two methods are feasible for consistently representing a specific level of emotion. However, further research on the feasibility of the two methods should be conducted in more situations.
The participants suggested that background color could be the “most helpful” feature and punctuation the “least helpful” to be added to the SAM. With the typographic cue, they suggested punctuation for the “most helpful” feature and emoji or symbols for the “least helpful.” It is notable that choices for most preferred correlated with the kind of interface used. More specifically, color was a chosen complement to a drawing, but punctuation was a chosen complement to text. The SAM itself was proposed as a graphical symbol in the current study. As it was not designed for such a purpose, the suggested features could be investigated to identify the effectiveness of the AAC system in future research.
Acoustic features were the most reported strategy for the participants to match the SAM and stylized typographic phrases to the voices. Prosodic features, such as pitch, loudness, and tempo, play an important role in individuals perceive and express emotions (Planalp, 1996; Wallbott & Scherer, 1986). The results of this study suggested that the SAM and typographic cues can visualize prosodic features of different levels of emotion. This might be applicable whether the communication partner perceives the variation of emotion using the SAM and stylized typographic cues, even if the synthesized speech has monotones in the AAC system in further research.
In the preference survey, 80% of the participants preferred the SAM over the stylized typographic phrases. The participants who preferred the SAM stated that it was easy to remember and visualize and looked more natural and intuitive. The participants who preferred the stylized typographic phrase reported that they could guess how the sentence sounded by reading the stylized typographic phrases. Based on the benefits reported by the participants, the SAM could be used regardless of age, culture, and educational background (Bradley & Lang, 1994). The typographic cues could allow AAC users to customize their messages depending on their emotional states. Customized features are critical components of individualized AAC intervention (Beukelman & Light, 2020). If a person uses an utterance-based device or if the written word is a main mechanism of communication, typographic cues can be useful for them to express various levels of emotion, like using a rating scale.
This study has several limitations. The voice used as stimuli was recorded by only one male professional. Also, most of the participants were females in their early 20s. It has been suggested that females tend to perceive emotional states with greater accuracy than males (Brody & Hall, 2010; Thompson & Voyer, 2014). Thus, future research with more participants after controlling for sex needs to be done. Lastly, this study investigated the feasibility of the two methods to express subtle levels of emotion in normal individuals. A follow-up study is required to examine whether these methods can be applied to AAC systems through more task questions and in a wide range of ages in individuals using AAC systems.
Recent advancements in artificial intelligence (AI) have significantly improved the naturalness of synthesized speech (Barakat et al., 2024; Mittag & Mollet, 2021). However, the digital literacy level among older adults is only about 64.3% of the general population (Hwang et al., 2020), and the level of digital informatization among people with disabilities remains relatively low (Lee & Lee, 2018). Due to these factors, AAC users in these demographics may face difficulties utilizing AI tools.
This study is meaningful in proposing a method for expressing emotions through a low-tech AAC system for such users. Furthermore, as AI and program algorithms continue to evolve, future research could explore whether the two methods proposed in this study can serve as real-time feedback tools to help AAC users express their emotions.
Acknowledgments
This study was conducted by research funds from Ohio University (2016).
References
-
Apple, W., Streeter, L. A., & Krauss, R. M. (1979). Effects of pitch and speech rate on personal attributions. Journal of personality and social psychology, 37(5), 715-727.
[https://doi.org/10.1037//0022-3514.37.5.715]

-
Bakker, I., Van Der Voordt, T., Vink, P., & De Boon, J. (2014). Pleasure, arousal, dominance: Mehrabian and Russell revisited. Current Psychology, 33(3), 405-421.
[https://doi.org/10.1007/s12144-014-9219-4]
-
Barakat, H., Turk, O., & Demiroglu, C. (2024). Deep learning-based expressive speech synthesis: A systematic review of approaches, challenges, and resources. EURASIP Journal on Audio, Speech, and Music Processing, 2024(1), 11.
[https://doi.org/10.1186/s13636-024-00329-7]
-
Becker, C., Kopp, S., & Wachsmuth, I. (2007). Why emotions should be integrated into conversational agents. In T. Nishida (Ed.), Conversational informatics: An engineering approach (pp. 49-68). Chichester, UK: John Wiley & Sons.
[https://doi.org/10.1002/9780470512470.ch3]
- Beukelman, D. R., & Light, J. C. (2020). Augmentative and alternative communication: Supporting children and adults with complex communication needs (5th ed.). Baltimore, MD: Paul H. Brookes Publishing.
-
Beukelman, D. R., Fager, S., Ball, L., & Dietz, A. (2007). AAC for adults with acquired neurological conditions: A review. Augmentative and Alternative Communication, 23(3), 230-242.
[https://doi.org/10.1080/07434610701553668]
- Boersma, P., & Weenink, D. (2016). Praat: Doing phonetics by computer (Version 6.0.19) [Computer software]. Retrieved from http://www.praat.org
-
Bradley, M. M., & Lang, P. J. (1994). Measuring emotion: The self-assessment manikin and the semantic differential. Journal of Behavior Therapy and Experimental Psychiatry, 25(1), 49-59.
[https://doi.org/10.1016/0005-7916(94)90063-9]
-
Brody, L. R., & Hall, J. A. (2010). Gender, emotion, and socialization. In J. C. Chrisler & D. R. McCreary (Eds.), Handbook of gender research in psychology: Volume 1. Gender research in general and experimental psychology (pp. 429-454). New York, NY: Springer.
[https://doi.org/10.1007/978-1-4419-1465-1_21]
-
Chang, S.-H., Chih, W.-H., Liou, D.-K., & Hwang, L.-R. (2014). The influence of web aesthetics on customers’ PAD. Computers in Human Behavior, 36, 168-178.
[https://doi.org/10.1016/j.chb.2014.03.050]
- University of Nebraska-Lincoln, AAC Laboratory. (n.d.). Common Phrase (1-4) [PDF file]. Retrieved in 2016 from https://cehs.unl.edu/documents/secd/aac/vocablists/CCPHSV2.pdf, (link no longer active)
-
Fallon, K. A., Light, J. C., & Paige, T. K. (2001). Enhancing vocabulary selection for preschoolers who require augmentative and alternative communication (AAC). American Journal of Speech-Language Pathology, 10(1), 81-94.
[https://doi.org/10.1044/1058-0360(2001/010)]
-
Ford, S., Forlizzi, J., & Ishizaki, S. (1997). Kinetic typography: Issues in time-based presentation of text. Proceedings of CHI EA ’97 (CHI ‘97 Extended Abstracts on Human Factors in Computing Systems), 269-270.
[https://doi.org/10.1145/1120212.1120387]
-
Forlizzi, J., Lee, J., & Hudson, S. (2003). The kinedit system: Affective messages using dynamic texts. Proceedings of the SIGCHI Conference on Human Factors in Computing Systems, 377-384.
[https://doi.org/10.1145/642611.642677]
-
Gross, J. J., & John, O. P. (2003). Individual differences in two emotion regulation processes: Implications for affect, relationships, and well-being. Journal of Personality and Social Psychology, 85(2), 348-362.
[https://doi.org/10.1037/0022-3514.85.2.348]
- Hall, M., Elliott, K., & Meng, J. G. (2017). Using the PAD (pleasure, arousal, and dominance) model to explain facebook attitudes and use intentions. The Journal of Social Media in Society, 6(1), 144-169.
- Hennig, S., Székely, É., Carson-Berndsen, J., & Chellali, R. (2012). Listener evaluation of an expressiveness scale in speech synthesis for conversational phrases: Implications for AAC. Paper presented at the 15th Biennial Conference of International Society for Augmentative and Alternative Communication (ISAAC), Pittsburgh, PA.
-
Higginbotham, D. J. (2010). Humanizing vox artificialis: The role of speech synthesis in augmentative and alternative communication. In J. Mullennix & S. Stern (Eds.), Computer synthesized speech technologies: Tools for aiding impairment (pp. 50-70). Hershey, PA: IGI Global.
[https://doi.org/10.4018/978-1-61520-725-1.ch004]
-
Hoag, L. A., Bedrosian, J. L., MCcoy, K. F., & Johnson, D. E. (2008). Hierarchy of conversational rule violations involving utterance-based augmentative and alternative communication systems. Augmentative and Alternative Communication, 24(2), 149-161.
[https://doi.org/10.1080/07434610802038288]
- Hwang, N., Kim, H. S., Kim, K. R., Joo, B. H., Hong, S. H., & Kim, J. H. (2020). Older adults and the digital divide: Current conditions and policy implications. Sejong: Korea Institute for Health and Social Affairs.
- IBM Corporation. (2013). IBM SPSS Statistics for Windows, Version 22.0 [Computer software]. Armonk, NY: Author.
-
Kang, R., Kim, Y. T., & Yeon, S. J. (2019). Cultural differences on the recognition of social word AAC graphic symbols between Korean and American undergraduate students. Communication Sciences & Disorders, 24(1), 71-86.
[https://doi.org/10.12963/csd.18542]
- Katsoulis, P., & Kourpupetoglou, G. (2015). How sighted and blind students perceive relational similarity between font-size and loudness in text-to-speech. The Turkish online Journal of Educational Technology, Special Issue for INTE, 245-251.
-
Kemper, T. D. (1987). How many emotions are there? Wedding the social and the autonomic components. American Journal of Sociology, 93(2), 263-289.
[https://doi.org/10.1086/228745]
-
Kong, Y.-Y., Mullangi, A., Marozeau, J., & Epstein, M. (2011). Temporal and spectral cues for musical timbre perception in electric hearing. Journal of Speech, Language, and Hearing Research, 54(3), 981-994.
[https://doi.org/10.1044/1092-4388(2010/10-0196)]
-
Lee, D., & Shin, S. (2020). Perception of the AAC graphic symbols and SNS Emoticons for emotional words in normal adults. Communication Sciences & Disorders, 25(2), 334-342.
[https://doi.org/10.12963/csd.20721]
-
Lee, H., & Lee, S.-H. (2018). A study on the relationship between digital informatization level and leisure life satisfaction of low income. Journal of Digital Convergence, 16(11), 29-36.
[https://doi.org/10.14400/JDC.2018.16.11.029]
-
Lee, J., Jun, S., Forlizzi, J., & Hudson, S. E. (2006). Using kinetic typography to convey emotion in text-based interpersonal communication. Proceedings of the 6th Conference on Designing Interactive Systems, 41-49.
[https://doi.org/10.1145/1142405.1142414]
-
Light, J., & Drager, K. (2007). AAC technologies for young children with complex communication needs: State of the science and future research directions. Augmentative and Alternative Communication, 23(3), 204-216.
[https://doi.org/10.1080/07434610701553635]
-
McCarthy, J., & Light, J. (2005). Attitudes toward individuals who use augmentative and alternative communication: Research review. Augmentative and Alternative Communication, 21(1), 41-55.
[https://doi.org/10.1080/07434610410001699753]
- Mehrabian, A. (1980). Basic dimensions for a general psychological theory: Implications for personality, social, and environmental, and developmental studies. Cambridge, MA: Oelgeschlager, Gunn & Hain.
-
Mehrabian, A. (1996). Pleasure-arousal-dominance: A general framework for describing and measuring individual differences in temperament. Current Psychology, 14(4), 261-292.
[https://doi.org/10.1007/bf02686918]
- Mehrabian, A., & Russell, J. A. (1974). An approach to environmental psychology. Cambridge, MA: The MIT Press.
- Millar, S., & Scott, J. (1998). What is augmentative and alternative communication? An introduction. In A. Wilson & S. V. Millar (Eds.), Augmentative communication in practice: An introduction, (Revised ed., pp. 3-12). Edinburgh, UK: CALL Scotland.
-
Mittag, G., & Möller, S. (2021). Deep learning-based assessment of synthetic speech naturalness. arXiv.
[https://doi.org/10.48550/arXiv.2104.11673]
-
Murray, I. R., Arnott, J. L., & Rohwer, E. A. (1996). Emotional stress in synthetic speech: Progress and future directions. Speech Communication, 20(1-2), 85-91.
[https://doi.org/10.1016/s0167-6393(96)00046-5]
-
Ortony, A., & Turner, T. J. (1990). What’s basic about basic emotions? Psychological Review, 97(3), 315-331.
[https://doi.org/10.1037//0033-295X.97.3.315]
-
Planalp, S. (1996). Varieties of cues to emotion in naturally occurring situations. Cognition and Emotion, 10(2), 137-154.
[https://doi.org/10.1080/026999396380303]
- Scherer, K. R. (1974). Acoustic concomitants of emotional dimensions: Judging affect from synthesized tone sequences. In S. Weitz (Ed.), Nonverbal communication (pp. 249-253). Oxford University Press.
-
Scherer, K. R. (2005). What are emotions? And how can they be measured? Social Science Information, 44(4), 695-729.
[https://doi.org/10.1177/0539018405058216]
- Qualtrics. (2017). Qualtrics [Computer software]. Provo, UT: Author. Retrieved from http://www.qualtrics.com
-
Thompson, A. E., & Voyer, D. (2014). Sex differences in the ability to recognise non-verbal displays of emotion: A meta-analysis. Cognition and Emotion, 28(7), 1164-1195.
[https://doi.org/10.1080/02699931.2013.875889]
-
Todman, J. (2000). Rate and quality of conversations using a text-storage AAC system: Single-case training study. Augmentative and Alternative Communication, 16(3), 164-179.
[https://doi.org/10.1080/07434610012331279024]
-
Todman, J., & Lewins, E. (1996). Conversational rate of a non-vocal person with motor neurone disease using the ‘TALK’ system. International Journal of Rehabilitation Research, 19(3), 285-287.
[https://doi.org/10.1097/00004356-199609000-00011]
-
Todman, J., Alm, N., Higginbotham, J., & File, P. (2008). Whole utterance approaches in AAC. Augmentative and Alternative Communication, 24(3), 235-254.
[https://doi.org/10.1080/08990220802388271]
-
Um, S.-Y., Oh, S., Byun, K., Jang, I., Ahn, C. H., & Kang, H.-G. (2020). Emotional speech synthesis with rich and granularized control. Proceedings of ICASSP 2020-2020 IEEE International Conference on Acoustics, Speech and Signal Processing, 7254-7258.
[https://doi.org/10.1109/icassp40776.2020.9053732]
-
Von Tetzchner, S., & Basil, C. (2011). Terminology and notation in written representations of conversations with augmentative and alternative communication. Augmentative and Alternative Communication, 27(3), 141-149.
[https://doi.org/10.3109/07434618.2011.610356]
-
Wallbott, H. G., & Scherer, K. R. (1986). Cues and channels in emotion recognition. Journal of Personality and Social Psychology, 51(4), 690-699.
[https://doi.org/10.1037/0022-3514.51.4.690]
- Waller, R. (1989). The typographic contribution to language: Towards a model of typographic genres and their underlying structures (Doctoral dissertation). University of Reading, Berkshire, UK.
-
Wilkinson, K. M., & Snell, J. (2011). Facilitating children’s ability to distinguish symbols for emotions: The effects of background color cues and spatial arrangement of symbols on accuracy and speed of search. American Journal of Speech-Language Pathology, 20(4), 288-301.
[https://doi.org/10.1044/1058-0360(2011/10-0065)]
-
Wong, Y. Y. (1996). Temporal typography: A proposal to enrich written expression. Proceedings of CHI ’96 (Conference Companion on Human Factors in Computing Systems), 408-409.
[https://doi.org/10.1145/257089.257401]
Appendix
Eleven phrases used in the three experiments
Survey example in the SAM task
Survey example in the stylized typographic phrase task
Example question and survey in the application task